[Microsoft] PowerBIカスタムビジュアルでInfragistics Ignite UIのData Gridを使う
はじめに
PowerBIのカスタムビジュアルでInfragistics Ignite UIを使う方法です。
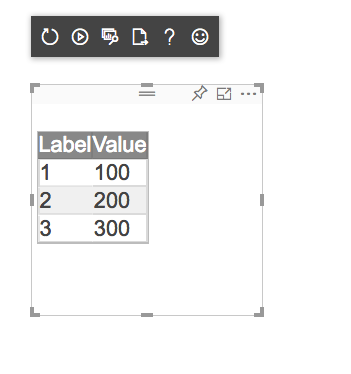
こんなんできました。

やらないといけないこと
- JQuery等のグローバルなオブジェクトを使えるようにする
- pbiviz.jsonのexternalJSセクションでJQuery, JQuery UI, Ignite UIを読み込む
JQuery等のグローバルなオブジェクトを使えるようにする
PowerBI内では、Windowオブジェクトがフェイクに置き換えられているそうです。
jQuery等が見えなくなります。
回避策として、以下のファイルを作成します。
src/jquery.adapter.js
var jQuery = typeof jQuery !== 'undefined' ? jQuery : window['$'];
Infragistics Ignite UIも見えなくなるので、以下のファイルを作成します。
src/infragistics.adapter.js
var igRoot = typeof igRoot !== 'undefined' ? igRoot : window['igRoot'];
var MSApp = typeof MSApp !== 'undefined' ? MSApp : window['MSApp'];
pbiviz.jsonのexternalJSセクションでJQuery, JQuery UI, Ignite UIを読み込む
pbiviz.jsonで作成したファイルを読み込みます。
pbiviz.json
  "externalJS": [
    "node_modules/jquery/dist/jquery.js",
    "src/jquery.adapter.js",
    "vendor/jquery-ui-1.12.1/jquery-ui.js",
    "vendor/ignite-ui/js/infragistics.core.js",
    "vendor/ignite-ui/js/infragistics.lob.js",
    "src/infragistics.adapter.js",
    "node_modules/powerbi-visuals-utils-dataviewutils/lib/index.js"
  ],
順番大事みたいです。
使い方
IVisual継承クラスのコンストラクタの中で、グリッドを作成します。
src/visual.ts
module powerbi.extensibility.visual {
    export class Visual implements IVisual {
        constructor(options: VisualConstructorOptions) {
            const target = jQuery(options.element);

            const table = jQuery('<table>');
            table.appendTo(target);

            try {
                table.igGrid({
                    dataSource: [
                        { Label: 1, Value: 100 },
                        { Label: 2, Value: 200 },
                        { Label: 3, Value: 300 }
                    ]
                });
            } catch (err) {
                console.log(err);
            }
        }
// (略)
ここではとりあえずお試し用の値を入れています。
スタイルシートも読み込んでおきます。
style/visual.less
@import './vendor/ignite-ui/css/themes/infragistics/infragistics.theme.less';
@import './vendor/ignite-ui/css/structure/infragistics.css';